

Calculate Your Factory's True Capacity
Unmask the hidden losses on your production floor. Try our free, interactive OEE calculator to analyze Availability, Performance, and Quality, and discover what your downtime is actually costing you.
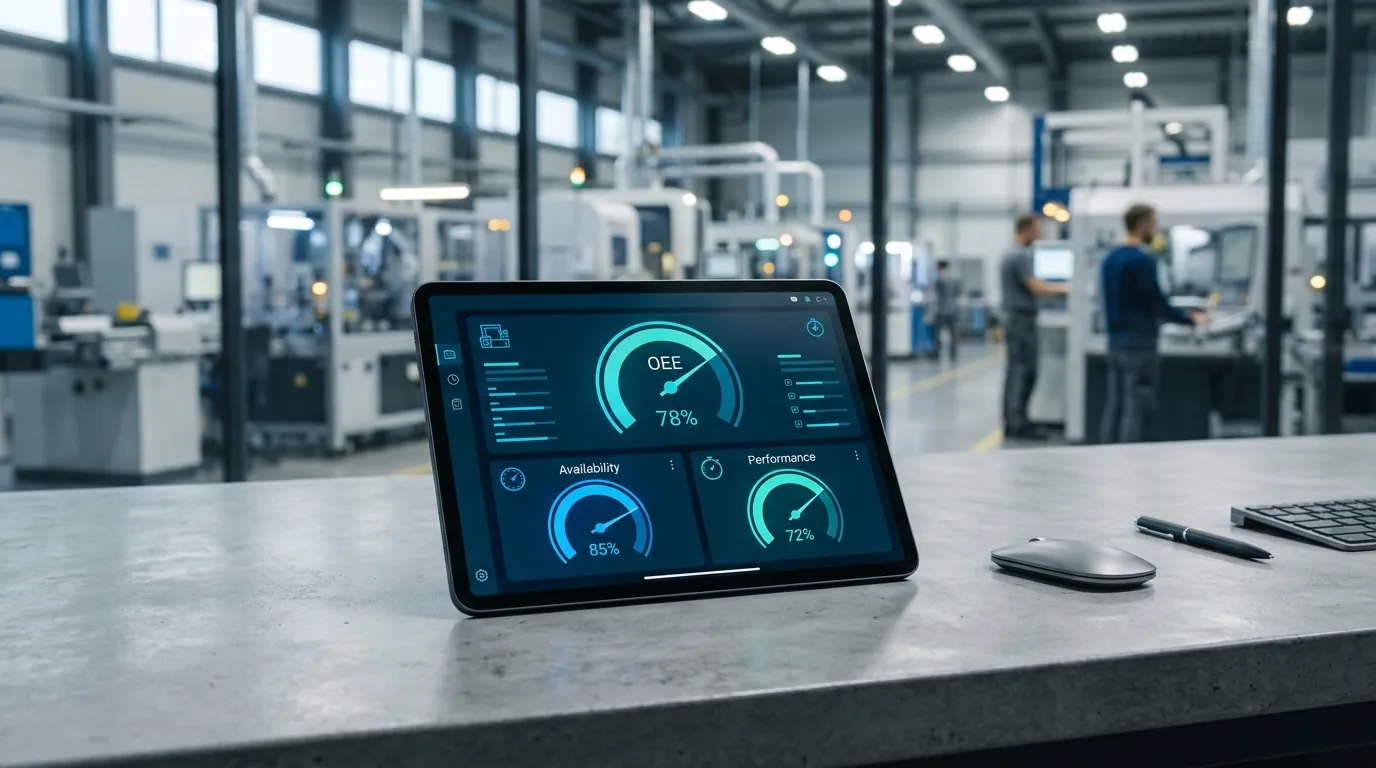
The Hidden Cost of Paper Logs
Running a manufacturing facility without live OEE metrics means navigating a process blind spot.
Spreadsheet Lag
Analyzing clipboard records at the end of the week is post-mortem reporting. You discover yesterday's bottlenecks when it's already too late to salvage the shift.
Unrecorded Micro-Stops
Operators don't log 30-second sensor trips or minor hopper jams. Yet, if a machine stops 40 times a day, you lose up to 20 minutes of capacity silently.
Sub-optimal Running Speeds
Running a machine at 80% of its designed speed to prevent part quality issues masks the underlying tooling wear or calibration drift.
Evaluate Your Machine Efficiency
Adjust the sliders or type in your factory numbers to calculate OEE factors and estimated downtime costs.
1. Input Metrics Real-time update
Total shift duration minus scheduled shutdowns (lunch breaks, planned safety briefs).
Unexpected stoppages: tool breakages, operator absence, mechanical halts, or minor stops.
The theoretical fastest time required to produce a single part.
Total units manufactured during the shift, including scrap.
Defective parts rejected during or after production, requiring scrap or rework.
Estimated value generated by this machine or line per hour (revenue or gross margin).
2. Overall Equipment Effectiveness (OEE) Result COMPUTING
Overall OEE
Opportunity Leakage
Estimated revenue lost during this shift from the gap between current OEE and world-class 85% OEE.
Optimize Your Factory Capacity
Download your calculation report + OEE Optimization Blueprint containing deployment architectures.
How Automated OEE Tracking Works
Manual log sheets miss minor stops and suffer from reporting bias. Here is the modern, automated telemetry architecture.
Non-Invasive Sensing
Optically-isolated current clamps or read-only Modbus connections monitor machines. PLCs and safety circuits are never modified.
Edge Computing
The edge gateway aggregates raw readings, timestamps state changes, computes Availability/Performance/Quality locally, and buffers data during network outages.
Unified Dashboard
Processed metrics stream securely via MQTT to a central dashboard. Shift managers, operations heads, and executives get a single pane of glass view of plant OEE.
Want to link your actual PLC data to this simulator?
We provide non-invasive gateway hardware that automatically maps machine signals directly to cloud dashboards.
Request a Custom Feasibility AssessmentDeploying OEE Across Your Plant
See how different manufacturing departments utilize automated OEE data to optimize throughput.
CNC Machine Shops
Monitor spindle utilization rates and cycle times to optimize tool swap cycles and detect minor tool-chatter stoppages.
Injection Moulding
Track clamping cycles and temperature parameters to reduce startup scrap and avoid nozzle wear defects.
Packaging Lines
Capture high-frequency conveyor minor stops and micro-stops that bypass manual shift log clipboard audits.
Stamping Presses
Connect force tonnage sensors to OEE dashboards to prevent catastrophic die failures and optimize stroke speed.
Structured Telemetry Output
Our edge gateways process high-frequency raw electrical signals at the machine level, publishing structured, lightweight JSON objects over secure MQTT to your centralized cloud platform.
Standardized Topics
Structured MQTT topic trees (e.g. `factory/site/line/machine/telemetry`) decouple data producers from downstream consumers.
Sub-Second State Profiling
Capture transitions in machine running state in milliseconds, guaranteeing that micro-stops are completely accounted for in OEE calculations.
integrated Buffering Meta
Telemetry packets append synchronization metadata, allowing edge nodes to sync cached offline data cleanly with zero database duplicates.
{
  "timestamp": 1785574570,
  "gateway_id": "edge_gw_pune_cnc_04",
  "metrics": {
    "state": "RUNNING",
    "cycle_count": 8500,
    "scrap_count": 340,
    "current_draw_amps": 14.8,
    "spindle_rpm": 3200
  },
  "oee_computed": {
    "availability": 87.50,
    "performance": 96.59,
    "quality": 96.00,
    "overall_oee": 81.14
  },
  "financial_metrics": {
    "lost_shift_value_inr": 1072.00,
    "alert_state": "NONE"
  }
}Frequently Asked Questions
Clear answers to help you evaluate automated OEE calculation tools.
See What Automated Tracking Can Do
Get accurate, real-time OEE data on your bottleneck lines and eliminate spreadsheet friction today.