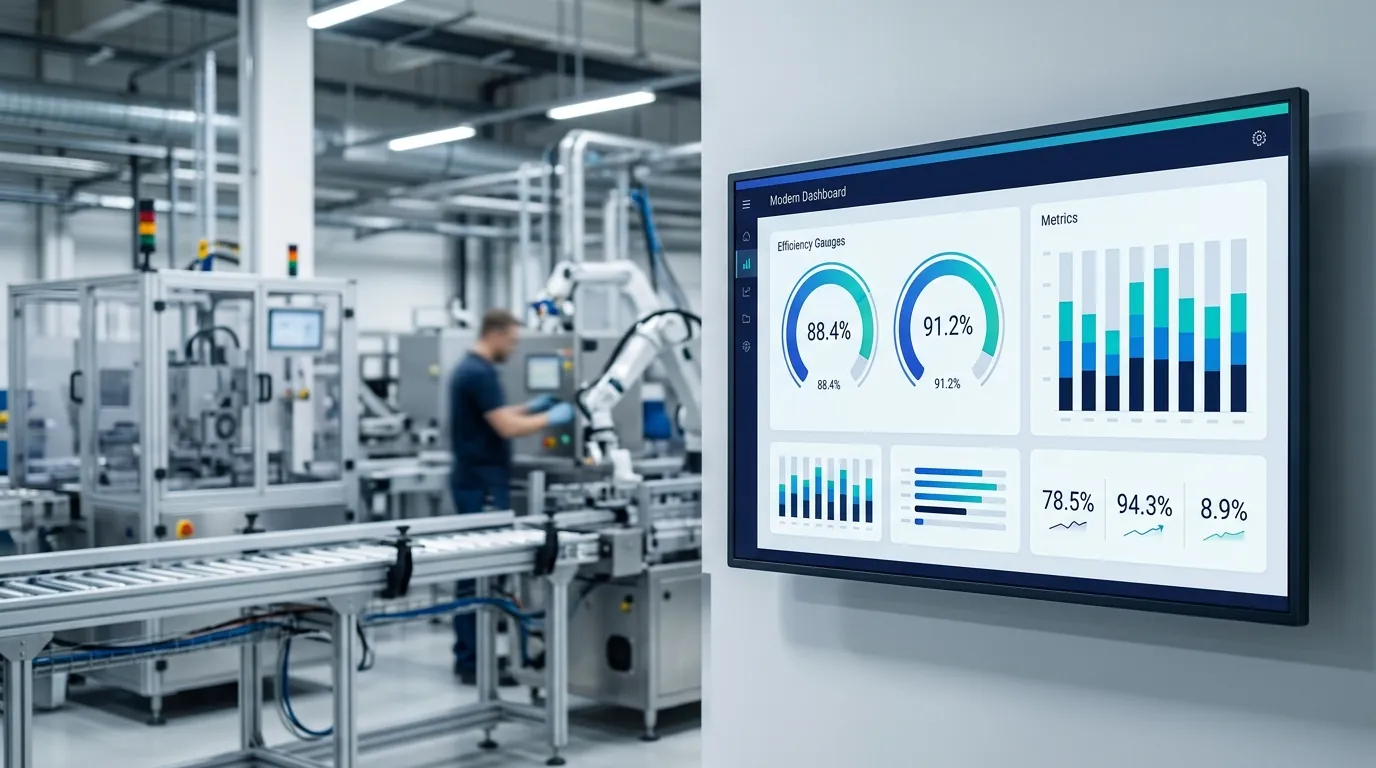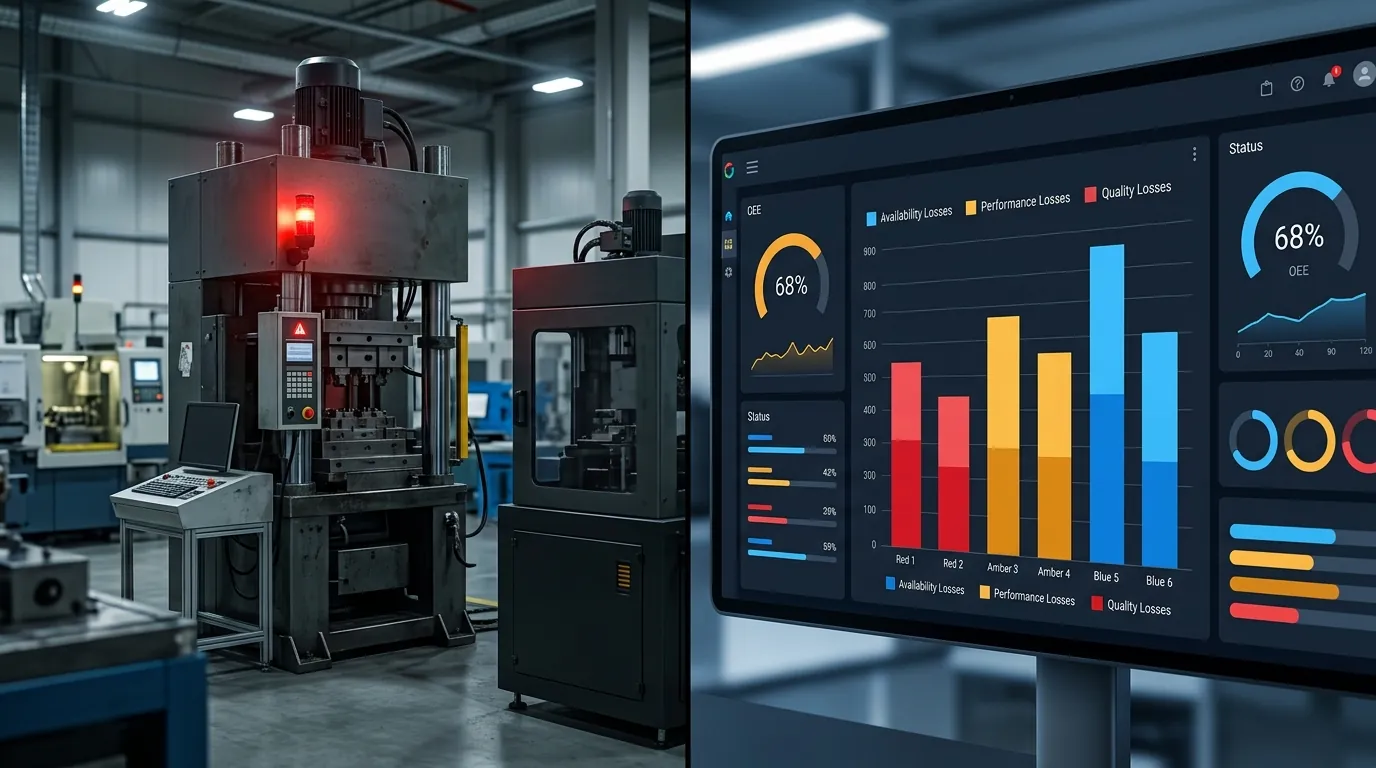

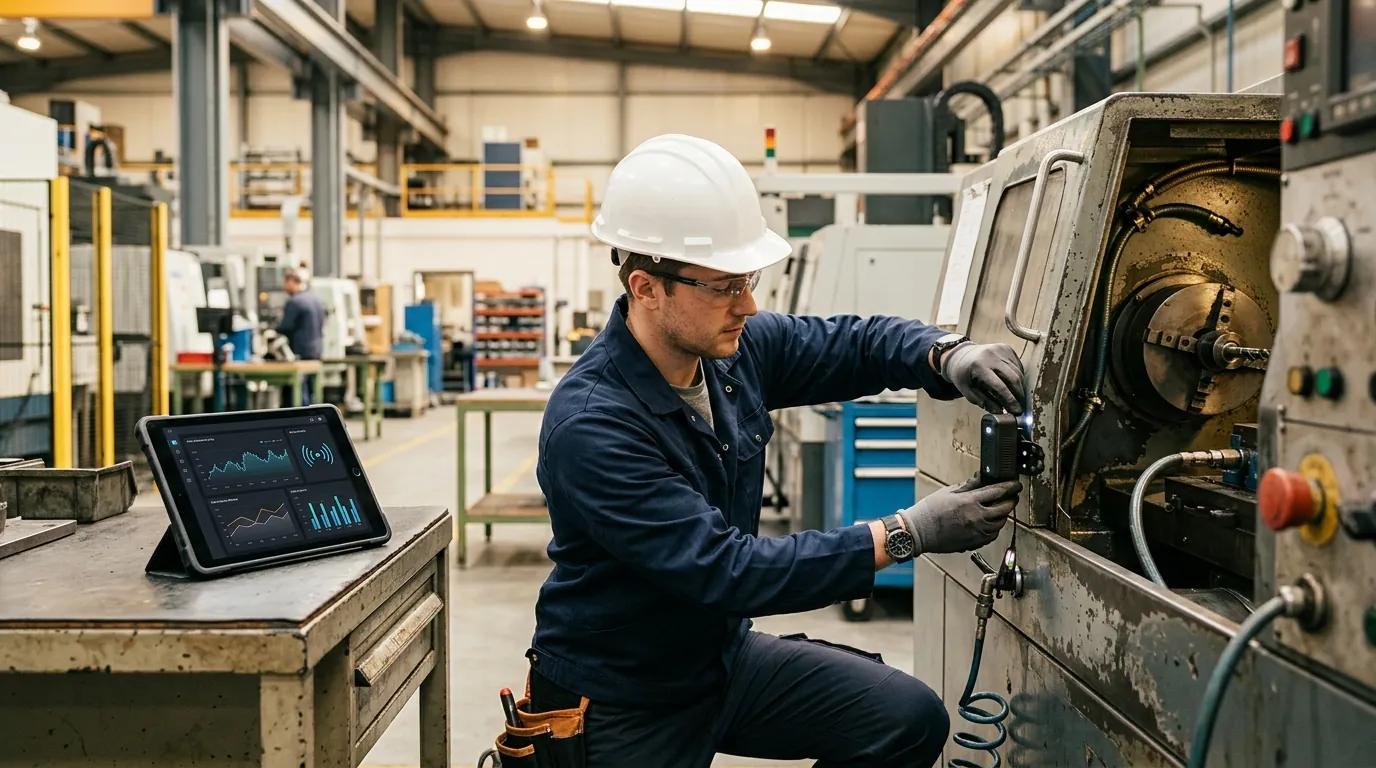
By the IIoT engineering team at AdaptNXT — who have connected machinery ranging from 1987 hydraulic presses to modern multi-axis CNC machining centres to the same real-time OEE dashboards.
Here is a question that comes up in almost every first conversation with a new manufacturing client:
"Our machines are old. Some of them are from the 1990s. Do we need to replace them before we can track OEE?"
The answer is no. Categorically, definitively, no.
In fact, legacy machines are often more important to monitor than modern ones — because they have no built-in diagnostics, no fault logging, and no visibility. Every breakdown is a surprise. Every stoppage is investigated after the fact. Legacy machines are the biggest contributors to poor OEE, and they are the last ones to ever get monitored. This guide explains how to fix that, using non-invasive IoT sensors and edge gateways, with zero risk to your existing production systems.
Why Legacy Machine Monitoring is the Hardest Problem in IIoT
The standard playbook for factory digitalisation assumes you have machines with modern PLCs, OPC UA servers, or at minimum clean digital I/O outputs. You point a software client at the PLC, subscribe to the tags you want, and data starts flowing. Clean, simple, fast.
But the reality of the average manufacturing floor — particularly in India, Southeast Asia, and even mature European plants — is very different. Consider what a typical brownfield factory floor actually contains:
- CNC lathes and milling machines from the 1990s and early 2000s, running on proprietary Fanuc or Siemens controllers with no network port
- Hydraulic presses with purely pneumatic control logic and no digital outputs at all
- Injection moulding machines with Modbus RTU serial interfaces that require a 9-pin RS-232 adapter and a register map that exists only in a dog-eared paper manual
- Conveyor systems and packaging lines controlled by relay logic — not PLCs
- Machines that are still in perfect condition mechanically and would cost millions to replace — but have no digital interface whatsoever
These machines contribute to OEE losses every day. They break down, they run slow, they produce rejects — and none of it is ever captured automatically. The data sits on a clipboard or lives in a supervisor's memory.
Non-invasive IoT monitoring solves this. Here is how.
The Core Principle: Read-Only, Non-Invasive Data Acquisition
The most important design constraint for any legacy machine monitoring project is this: you must never modify, interfere with, or compromise the machine's existing control system.
This means:
- No changes to PLC ladder logic or function block programs
- No tapping into safety-critical signal lines
- No new connections to control bus networks that could introduce electrical noise
- No downtime required to install the monitoring system
Fortunately, there are four well-proven approaches to extracting machine state data without violating any of these constraints. Which one is right for a specific machine depends on what physical signals are available.
Method 1: Current-Clamp Sensing (The Universal Approach)
Every machine that runs on AC power draws current when it is running and draws almost no current when it is idle. A current-clamp sensor (also called a split-core current transformer or CT clamp) clips around the machine's main power supply cable without any electrical connection — it reads the magnetic field generated by current flow. No wiring. No tapping. No risk.
This is the most universally applicable method because it works on any electrically powered machine, regardless of age, manufacturer, or control system:
- If the current is above a calibrated threshold → machine is Running
- If the current drops below threshold → machine is Idle or Off
- If the current signature is abnormal (e.g., spiking at unusual intervals) → potential anomaly detected
Current-clamp sensing directly supports the Availability component of the OEE formula — you know exactly when the machine was running and when it was not, to the second.
Resolution and accuracy: Modern CT clamps with 16-bit ADC sampling at 1kHz can detect state changes with sub-second resolution and can also capture enough of the motor's current signature to distinguish between different operating modes (idle motor, light cutting, heavy cutting) — providing crude but useful Performance insight as well.
Installation
Clip the CT clamp around the machine's main power cable inside the electrical panel (or externally on the supply feed). Connect to the AdaptNXT edge gateway's analog input. Calibrate the running-vs-idle threshold during a test cycle. No machine shutdown required in most cases — the clamp clips on while the machine runs.
Method 2: Read-Only Modbus Integration (For Machines with Modbus RTU/TCP)
Many machines built from the mid-1990s onwards — including most CNC controllers, VFD-controlled motors, and industrial chillers — have a Modbus RTU (RS-485 serial) or Modbus TCP (Ethernet) port that was originally intended for SCADA connectivity. This port exposes a wealth of machine state data through numbered register addresses.
The critical insight: Modbus is a request-response protocol. The edge gateway acts as a Modbus Master, polling the machine's Modbus registers at a defined interval (e.g., every 2 seconds). The machine is always the Slave — it simply responds to read requests. The gateway never writes to the machine. This is inherently safe and inherently non-invasive.
Typical registers available via Modbus on CNC and production equipment include:
- Machine state (running, stopped, alarm, setup)
- Cycle count (parts produced since last reset)
- Spindle speed (RPM) — directly relevant to Performance calculation
- Feed rate and override percentage
- Active alarm codes — the machine's own fault classification system
- Temperature and pressure sensors (where fitted)
With cycle count and machine state from Modbus, you can calculate all three OEE components automatically: Availability from state, Performance from cycle time versus ideal, and Quality by connecting to your quality inspection data. For the full technical implementation of a Modbus-to-MQTT bridge, see our detailed guide: Modbus to MQTT: Retrofitting Legacy Machinery for Cloud Telemetry.
The challenge: You need the machine's register map — the table that tells you which register address corresponds to which measurement. This document is usually available from the machine manufacturer's support team, sometimes buried in the original installation manual. If it cannot be found, AdaptNXT's engineers can often reverse-engineer the key registers through systematic polling and observation.
Method 3: Proximity Sensor / Photoelectric Sensor on the Machine Output
For machines that produce discrete parts — stamping presses, injection moulders, lathes — the most direct way to count production output is to place a photoelectric sensor or proximity switch in the part exit path. Every time a part passes the sensor, a pulse is generated and counted by the edge gateway.
This approach delivers the cleanest possible data for the Quality component of OEE (by connecting the part count to a downstream quality inspection result) and for the Performance component (by comparing actual cycle time per part to the ideal). It is also completely independent of the machine's control system — the sensor simply observes the output, it does not interface with any machine logic.
Combined with a current-clamp sensor for Availability (running/idle state), a photoelectric part counter gives you complete OEE data on virtually any machine, regardless of its vintage or control technology.
Method 4: Vibration Sensor for Advanced Machines
For machines where both running/idle detection and deeper health insight are needed — CNC spindles, rotating equipment, gearboxes, pumps — a vibration sensor (accelerometer) attached to the machine casing provides a rich signal.
At its simplest level, vibration amplitude distinguishes running from idle (supporting Availability tracking). At a more sophisticated level, vibration frequency analysis can distinguish between different operating modes, detect bearing wear, imbalance, and misalignment before they cause breakdown — directly supporting predictive maintenance and improving future Availability.
This is the approach used in our Tier-1 auto parts manufacturer deployment, where vibration sensors on 40 CNC machines improved OEE from 58% to 78% and delivered ROI in 4.5 months.
The Edge Gateway: The Unifying Layer
Regardless of which sensing method is used (or which combination — many machines use two or three simultaneously), all sensor signals flow into the edge gateway. The gateway is the intelligence layer that:
- Collects raw sensor signals from multiple machines simultaneously
- Applies the OEE calculation logic: tracks machine state, counts cycles, classifies downtime events
- Applies the Availability, Performance, and Quality formulas in real time
- Streams the OEE data and raw telemetry to the cloud dashboard via MQTT over TLS
- Buffers data locally if connectivity drops — so OEE data is never lost during network outages (see our guide on resilient store-and-forward gateway buffering)
Critically, the gateway is optically isolated from the machine's electrical system. This means no electrical path exists between the gateway and the machine's control circuits. Even in the event of a gateway failure, the machine's PLC and safety systems are completely unaffected.
Handling Mixed-Fleet Factories
Most real manufacturing plants are not homogeneous — they have a mix of old and new equipment, from different manufacturers, using different protocols and interfaces. This is actually where the approach described above shines.
A well-designed edge gateway can simultaneously:
- Poll a 1990s CNC machine's Modbus RTU registers over RS-485
- Read current-clamp data from an analog hydraulic press
- Subscribe to a modern machine's OPC UA tags over Ethernet
- Count parts from a photoelectric sensor on a conveyor line
All of these data streams are unified into the same OEE calculation framework. The cloud dashboard shows every machine on the same dashboard, using the same OEE metric, regardless of the underlying data source. This is the "single pane of glass" view that plant managers have traditionally been unable to achieve with mixed-age equipment. Learn more about the architecture in our guide on scalable IIoT architecture for multi-site manufacturing.
What You Will See in the First Week
In our experience deploying legacy machine monitoring across dozens of plants, here is what happens in the first week of accurate automated OEE data:
- The real numbers are a shock. Plants that thought they had 75%+ OEE (based on manual tracking) discover their actual OEE is 52–60%. The gap is almost entirely micro-stops and minor speed losses that manual logging never captured.
- The top loss driver becomes obvious immediately. It is usually one machine (the bottleneck) and one loss category (typically unplanned stoppages or changeover duration). Without OEE data, teams spend energy on many things at once. With data, they can focus on the one thing that matters most.
- Shift-to-shift and operator-to-operator differences become visible. The same machine on morning shift might run at 78% OEE. On night shift, it runs at 61%. That difference is the starting point for a very valuable conversation about training, supervision, and process standardisation.
A Practical Deployment Checklist for Legacy Machine OEE Monitoring
- ☐ Machine survey: Identify all machines to be monitored. Note manufacturer, model, year, and any existing communication ports (Modbus RTU port? Ethernet port? Relay outputs?).
- ☐ Sensing method selection: For each machine, determine the appropriate data acquisition method (current-clamp, Modbus read, proximity sensor, vibration, or combination).
- ☐ Register map retrieval: If using Modbus, obtain register maps from manufacturer support or through engineering reverse-engineering.
- ☐ Ideal cycle time documentation: Record the designed ideal cycle time for each machine and each product variant. This is the baseline for Performance calculation.
- ☐ Downtime reason code definition: Agree on 6–12 downtime reason codes with the operations team before deployment. These become the diagnostic backbone of the OEE system.
- ☐ Gateway placement: Mount edge gateway in or near the electrical panel. Verify network connectivity (Wi-Fi or cellular) and power supply.
- ☐ Calibration run: Run the machine through a known production cycle to calibrate threshold values and verify OEE calculation accuracy.
- ☐ Dashboard setup: Configure the cloud dashboard with machine names, ideal cycle times, shift schedules, and OEE alert thresholds.
The AdaptNXT Approach: 8-Week OEE Pilot for Legacy Factories
Our standard engagement for first-time OEE monitoring deployments is a fixed-scope, fixed-budget 8-week pilot:
- Week 1–2: Machine survey, sensor selection, gateway installation, and first OEE data flowing to dashboard.
- Week 3–4: Baseline OEE established per machine. Top three loss categories identified. Initial root-cause analysis with operations team.
- Week 5–8: First improvement actions tracked. OEE trend established. Business case quantified for full factory rollout.
At the end of 8 weeks, you have a verified OEE number for your most critical machines, a clear picture of where your production losses are hiding, and the data to justify (or not) scaling the system across the entire plant. Contact us to scope your pilot →