
By the industrial automation team at AdaptNXT — engineers who have deployed OEE monitoring systems across auto parts plants, pharmaceutical facilities, and food manufacturing lines.
Every plant manager I have ever sat down with carries the same frustration: they know their machines could produce more, but they cannot pinpoint exactly where the time is going. Shifts end, throughput numbers are calculated, and somewhere between the target and the actual there is a gap — a gap that costs real money every single day.
OEE is the metric that closes that gap. Not by guessing. By measuring.
This guide will walk you through everything you need to know about Overall Equipment Effectiveness — what it is, how to calculate it correctly, what the numbers mean, and how modern manufacturers are automating it so the data is accurate, real-time, and actionable.
What is OEE (Overall Equipment Effectiveness)?
OEE (Overall Equipment Effectiveness) is a standardised metric used in manufacturing to measure how efficiently and productively a piece of equipment, a production line, or an entire factory is being utilised relative to its full potential.
It was first formalised by Seiichi Nakajima as part of the Total Productive Maintenance (TPM) framework in the 1960s and has since become the single most widely used KPI in global manufacturing. The reason it endures is simple: it takes three things that every plant manager cares about — uptime, speed, and quality — and compresses them into a single, unambiguous number.
OEE is expressed as a percentage. A score of 100% means your equipment is running all of the time it is supposed to run, at exactly the speed it is designed to run, producing nothing but perfect output. In practice, no factory achieves 100%. But the pursuit of it is what drives continuous improvement.
"OEE doesn't tell you you're failing. It tells you exactly how you're failing, and where to start fixing it."
The OEE Formula
The OEE formula is elegantly simple:
OEE = Availability × Performance × Quality
Each of the three factors is itself a ratio, expressed as a percentage between 0% and 100%. Multiplying them together gives you the overall OEE score. Let's break each one down precisely.
1. Availability
Availability measures what fraction of the planned production time your equipment was actually running and producing (or could produce). It accounts for all unplanned downtime events that stop production.
Availability = Run Time ÷ Planned Production Time
- Planned Production Time is total shift time minus scheduled stops (planned maintenance, shift changeovers, lunch breaks).
- Run Time is Planned Production Time minus any unplanned downtime (breakdowns, material shortages, operator absence, tooling failures).
Example: If your shift is 8 hours (480 minutes) and you schedule 30 minutes for changeovers, your Planned Production Time is 450 minutes. If the machine breaks down for 45 minutes during the shift, your Run Time is 405 minutes. Availability = 405 ÷ 450 = 90%.
2. Performance
Performance measures how fast the equipment actually ran during the time it was running, compared to its designed maximum speed. It captures speed losses — situations where the machine is running, but slower than it should be, either due to degraded conditions or micro-stops.
Performance = (Ideal Cycle Time × Total Count) ÷ Run Time
- Ideal Cycle Time is the theoretical fastest possible time to produce one unit.
- Total Count is all units produced (including defects).
Example: Your machine's ideal cycle time is 30 seconds per part. During 405 minutes of run time, you produced 700 parts. Ideal output at 100% performance would be 405 × 60 ÷ 30 = 810 parts. Performance = 700 ÷ 810 = 86.4%.
3. Quality
Quality measures what fraction of all parts produced were good parts — ones that meet specification on the first pass. It accounts for all scrap, rework, and startup rejects.
Quality = Good Count ÷ Total Count
Example: Of your 700 parts, 672 passed quality inspection on the first pass. Quality = 672 ÷ 700 = 96%.
Putting It Together
OEE = 90% × 86.4% × 96% = 74.6%
Notice how each factor seems reasonable on its own — 90% uptime, 86% speed, 96% quality — yet the combined OEE is only 74.6%. This is the power of OEE: it reveals the compounding effect of individual losses that would otherwise seem acceptable in isolation.
What is a Good OEE Score?
The globally accepted OEE benchmarks are:
| OEE Score | Classification | What It Means |
|---|---|---|
| Below 50% | Unacceptable | Significant losses everywhere. Usually indicates poor maintenance culture or major process instability. |
| 50%–65% | Below Average | Common starting point. There are clear opportunities for quick wins through better data and targeted maintenance. |
| 65%–75% | Average | Where most manufacturing plants sit. Acceptable but leaves meaningful capacity on the table. |
| 75%–85% | Good | Proactive maintenance in place. Teams are tracking and addressing losses systematically. |
| 85%+ | World-Class | The benchmark set by Nakajima. Achieved by companies with mature TPM programs and real-time monitoring. |
The important caveat: a score of 85% on one type of equipment (say, a high-volume injection moulding line) is not the same as 85% on a batch-process chemical reactor. Context matters. What you should always track is your OEE trend over time — are you improving, stable, or declining? That trend is what tells the real story.
The Six Big Losses: What's Actually Driving Your OEE Down
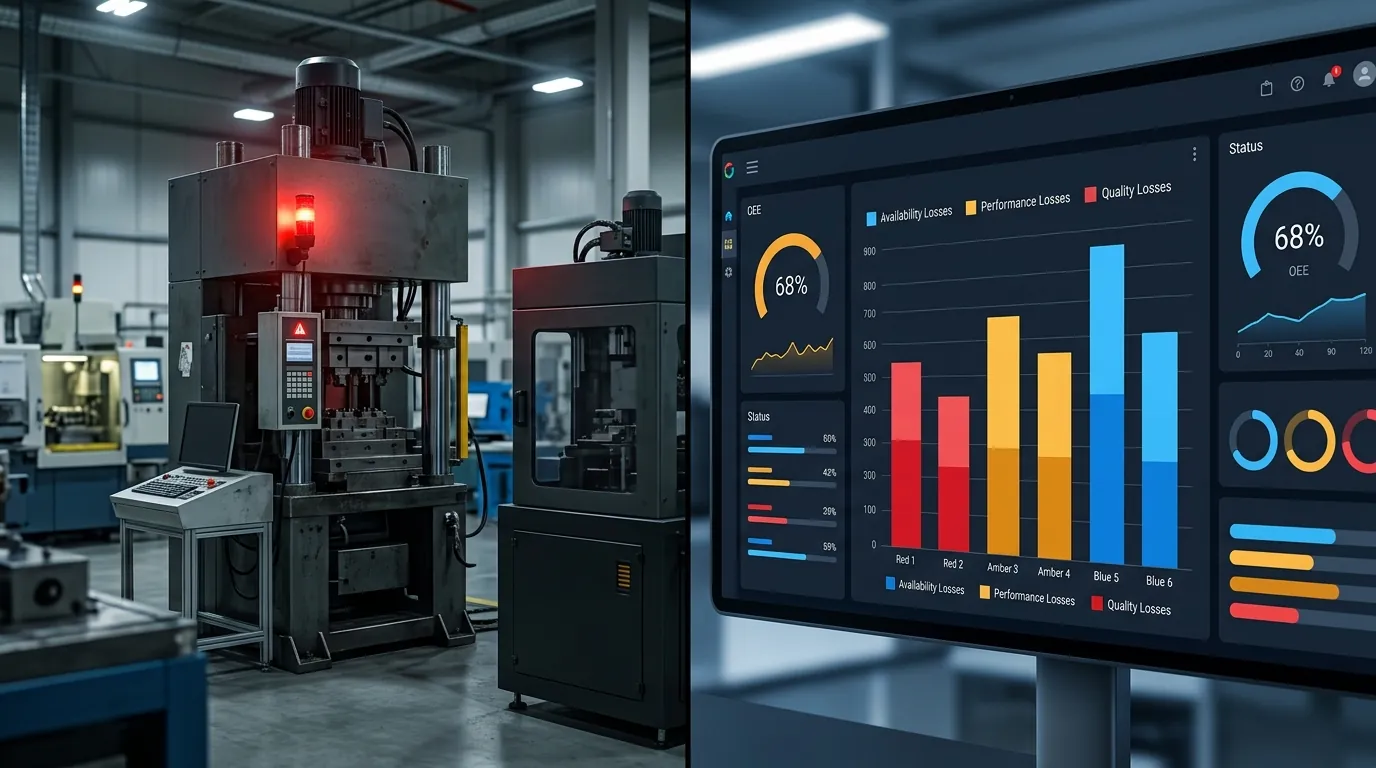
OEE becomes most powerful not as a single number but as a diagnostic tool. The "Six Big Losses" framework (defined as part of TPM) categorises every possible form of production loss into one of six buckets — three affecting Availability, one affecting Performance, and two affecting Quality.
Understanding which of the six losses is your biggest problem tells you exactly where to focus improvement energy. For a deeper dive, see our companion post on the Six Big Losses and how real-time monitoring catches them automatically.
Losses Affecting Availability
- Unplanned Stops (Breakdowns): Equipment fails unexpectedly — the most visible and emotionally painful OEE loss. A spindle bearing fails, a hydraulic seal bursts. Production stops until the repair is complete. Predictive maintenance eliminates most of these.
- Planned Stops (Setup & Adjustments): Changeovers, tooling changes, die swaps, shift handovers. These are counted in OEE if they take longer than the planned time. SMED (Single-Minute Exchange of Die) methodology systematically reduces these.
Losses Affecting Performance
- Small Stops (Idling & Minor Stoppages): Brief interruptions of less than 5–10 minutes — a jam clears, a sensor trips, an operator adjusts something — that individually seem trivial but collectively consume 15–30% of production capacity in most plants. These are nearly invisible without automated monitoring because they're too short to log manually but happen too frequently to ignore.
- Reduced Speed (Slow Cycles): The machine is running, but below its designed throughput rate. Often caused by worn tooling, material inconsistencies, or operators intentionally slowing machines to prevent quality problems. Automated cycle-time tracking is the only reliable way to catch this.
Losses Affecting Quality
- Startup Rejects: Scrap and rework produced during the warm-up or startup phase — before the process has stabilised. Common in processes sensitive to temperature or pressure (injection moulding, die casting, extrusion).
- Production Defects: Scrap, rework, and non-conforming product produced during normal steady-state production. Every defective part represents wasted material, machine time, and labour.
Manual OEE Tracking vs. Automated OEE Monitoring
Most manufacturers who start tracking OEE do so on paper or in Excel. A supervisor carries a clipboard, logs downtime events when they happen, counts parts at end of shift, and enters the data after the fact. It is better than nothing — but it has three fatal flaws.
The Problem with Manual OEE
- It misses micro-stops entirely. No operator consistently logs a 45-second sensor trip. Over a week, those unreported micro-stops add up to hours of lost production that never appear in the OEE calculation.
- It is always retrospective. By the time the data is analysed, the shift is over, the supervisor has gone home, and the opportunity to intervene has passed.
- It is subject to reporting bias. Operators and supervisors (understandably) underreport losses that would reflect negatively on their performance. The result is an OEE number that looks better than reality — which is actually more dangerous than no number at all, because it stops management from taking action.
Automated OEE Monitoring: What Changes
When OEE is calculated automatically from live machine data via IoT sensors and edge gateways, every one of those problems is eliminated:
- Every cycle is counted automatically — no human logging required.
- Every state change (running, idle, fault, changeover) is timestamped to the second.
- Every micro-stop is captured, classified, and counted.
- The OEE score updates in real time — plant managers see the current OEE on their dashboards during the shift, not the next morning.
The OEE numbers that automated systems reveal are typically 10–20 percentage points lower than the manually tracked equivalent — not because performance has gotten worse, but because the data is now honest.
How Automated OEE Tracking Works: From Machine to Dashboard
Understanding the technology behind automated OEE monitoring is important — particularly for manufacturers concerned about the cost and complexity of retrofitting existing equipment. The good news: modern machine monitoring systems are designed to work with the machines you already have, without requiring PLC modifications.
Step 1: Data Acquisition at the Machine
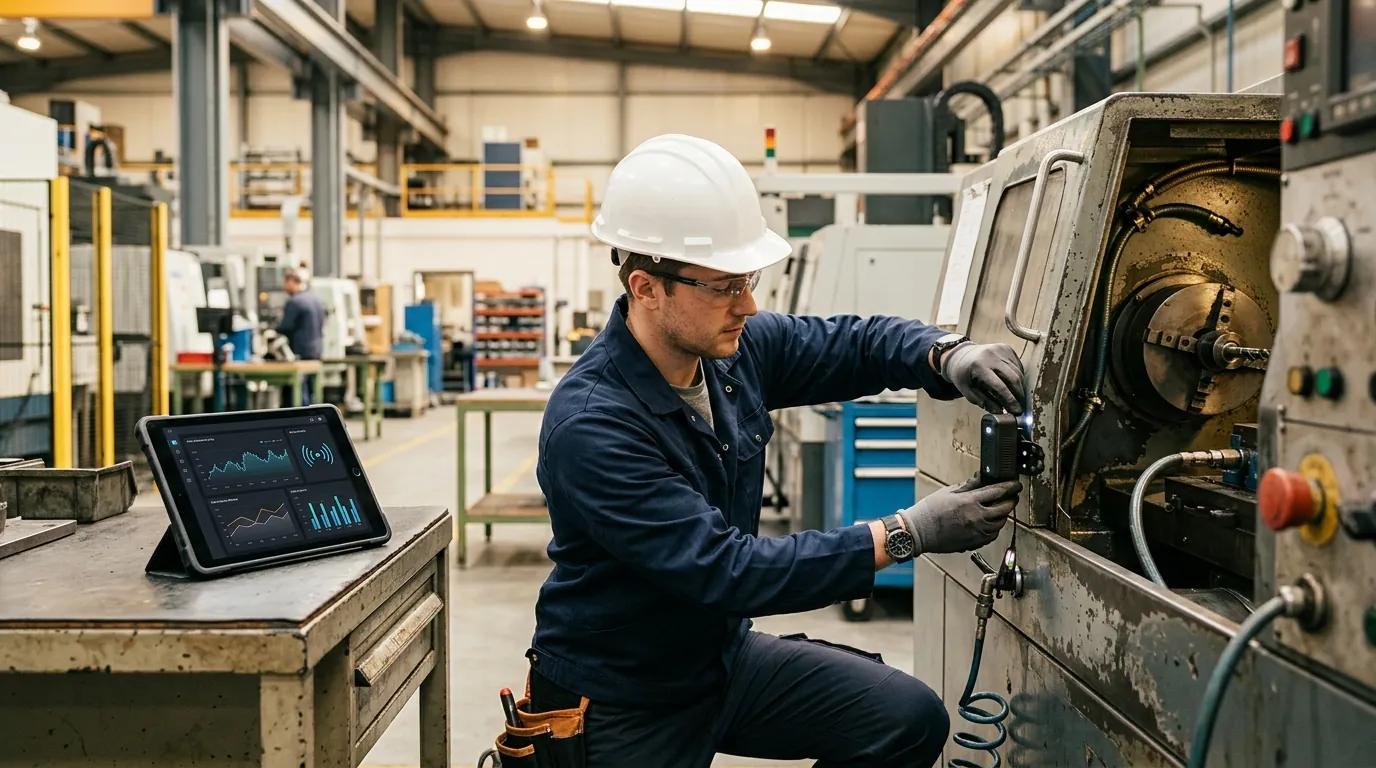
Sensors are attached to or connected with the machine. For modern machines with PLCs, this typically means reading registers over Modbus RTU/TCP or OPC UA in a read-only mode — so no PLC code is ever modified. For older legacy machines, current-clamp sensors on power supply lines can determine machine state (running, idle, off) purely from electrical signature, requiring no connection to the machine's control system at all.
Learn more about retrofitting legacy machines for cloud telemetry using Modbus and MQTT.
Step 2: Edge Gateway Processing
A ruggedised edge gateway sits between the machines and the cloud. It polls sensors at high frequency (typically every 1–5 seconds), applies the OEE calculation logic locally (detecting state changes, counting cycles, classifying downtime reasons), and streams structured telemetry upward. Critically, if the internet connection drops, the gateway buffers data locally and syncs when connectivity is restored — so no data is ever lost.
Step 3: Cloud Dashboard and Alerting
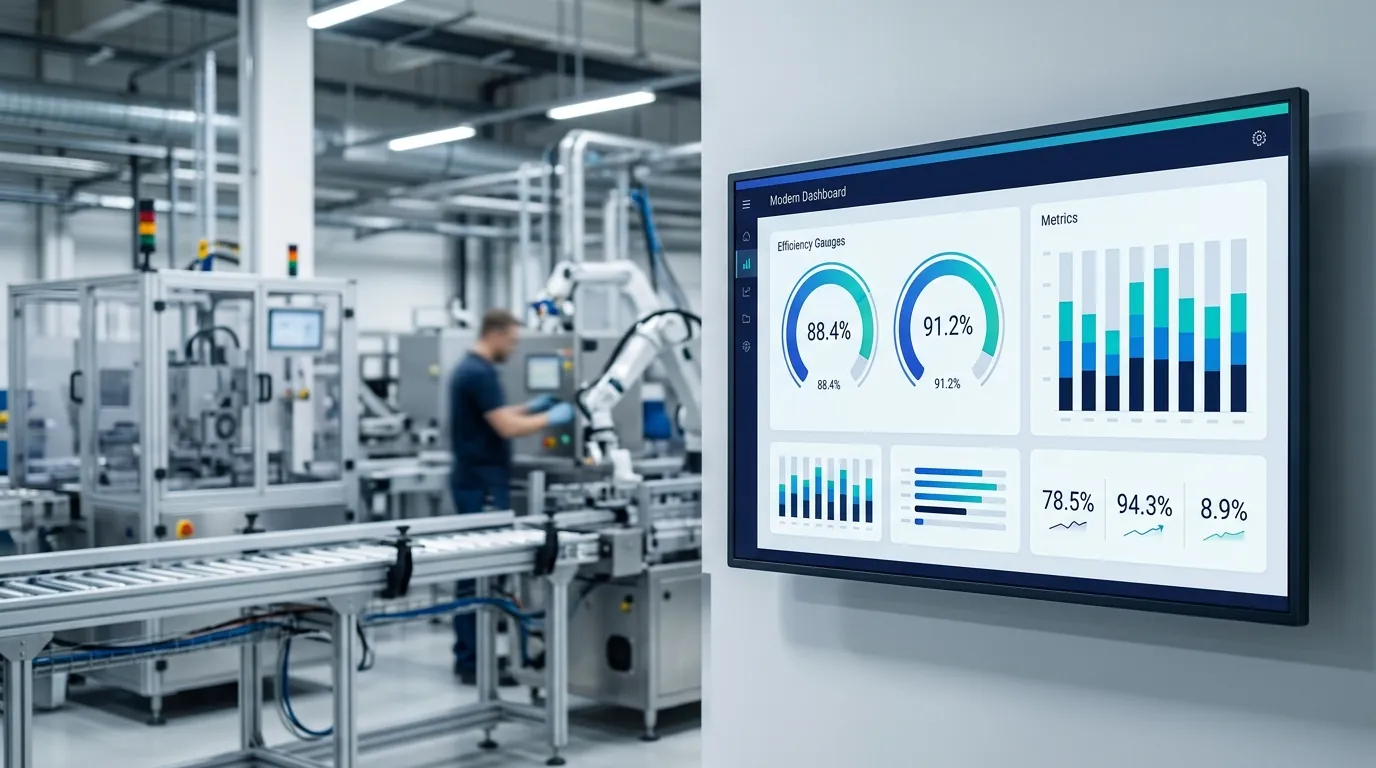
The processed OEE data flows into a cloud platform that presents live dashboards — OEE by machine, by line, by shift, by day — and sends alerts when OEE drops below a threshold or when anomalous patterns are detected. This is the intelligence layer that turns raw sensor data into actionable production insight.
OEE in the Context of a Digital Twin
OEE is also the primary data input for digital twins in manufacturing. A digital twin needs a continuous, accurate stream of real-world performance data to maintain its live virtual model of the physical asset. OEE tracking — specifically the second-by-second state data that automated monitoring provides — is what keeps the twin accurate. Without it, the twin is just a static 3D model.
OEE and Predictive Maintenance
OEE identifies the symptom (reduced Availability from breakdowns). Predictive maintenance addresses the root cause (the impending failure that caused the breakdown). The two systems are designed to work together:
- Your OEE dashboard flags that Machine 07 has had its Availability drop from 92% to 78% over the past two weeks.
- Your anomaly detection system simultaneously flags that Machine 07's vibration signature has shifted — a pattern historically associated with bearing wear.
- A maintenance work order is automatically generated. The bearing is replaced during a planned weekend shift. Machine 07's Availability recovers to 92%.
This is the full loop: measure → detect → predict → prevent → measure again. OEE is both the starting point and the proof of success.
Getting Started: A Practical OEE Roadmap
Step 1: Pick One Machine to Start
Don't try to instrument your entire factory in week one. Identify your most critical bottleneck machine — the one whose downtime cascades into everything else. Start there. Get accurate OEE data on that machine. Fix the top two losses. Then scale.
Step 2: Define Your States and Reasons
Before data collection begins, agree on how you will classify machine states (Running, Planned Stop, Unplanned Stop, Changeover, Minor Stop) and the reason codes within each. The most valuable insight from OEE data comes from the reason codes — not just "machine was down for 45 minutes" but "machine was down for 45 minutes due to tooling changeover."
Step 3: Start With Automated Data Collection
If you start with manual data entry, you will get biased numbers. The most reliable way to establish a true OEE baseline is with automated sensor-based monitoring from day one. An 8-week pilot programme, monitoring 3–8 machines with non-invasive IoT sensors, is typically enough to establish baseline OEE, identify the top three loss drivers, and build the business case for a full rollout.
Step 4: Act on the Data, Not the Score
An OEE score is only valuable if it drives action. Set a weekly OEE review cadence. Walk through the top three loss categories with the maintenance team and shift supervisors. Agree on one specific improvement action per week. Track whether it moves the needle the following week.
Summary: Key OEE Concepts at a Glance
| Concept | Definition | Improvement Lever |
|---|---|---|
| Availability | Run Time ÷ Planned Production Time | Predictive maintenance, SMED changeovers |
| Performance | (Ideal Cycle Time × Total Count) ÷ Run Time | Eliminate micro-stops, tooling maintenance |
| Quality | Good Count ÷ Total Count | SPC, startup scrap reduction, CV inspection |
| World-class OEE | 85%+ | Sustained continuous improvement culture |
| Industry Average | ~60% | Most plants have 20–25 points of headroom |
Ready to Track OEE Automatically on Your Factory Floor?
AdaptNXT's OEE & Machine Monitoring System connects to both modern and legacy manufacturing machines — without modifying your PLCs — and delivers a live OEE dashboard within days of installation. Our 8-week pilot programme gives you a verified OEE baseline, root-cause analysis on your top loss categories, and a measurable improvement roadmap.
Explore how to track OEE on older equipment in our next guide: How to Monitor OEE on Legacy Machines Without Touching Your PLCs →
Or see how we helped a Tier-1 auto parts manufacturer move from 58% to 78% OEE: Read the case study →